
Answer questions as fast as you can think of them with Desktop
Tableau Desktop is based on breakthrough technology from Stanford University that lets you drag & drop to analyze data. You can connect to data in a few clicks, then visualize and create interactive dashboards with a few more.
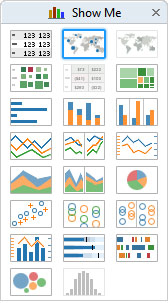
We’ve done years of research to build a system that supports people’s natural ability to think visually. Shift fluidly between views, following your natural train of thought. You’re not stuck in wizards or bogged down writing scripts. You just create beautiful, rich data visualizations.
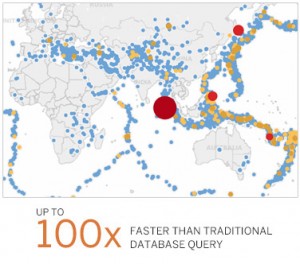
It’s so easy to use that any Excel user can learn it. Get more results for less effort. And it’s 10 –100x faster than existing solutions.
Red Ocean
Longest experience in Norway
We offer:
- Analytics as-a-service
- Installation and training
- Counseling for integration
Information
For more information, send e-mail: software@redocean.no or call Nicholas +47 414 15 414.
10 – 100x Faster
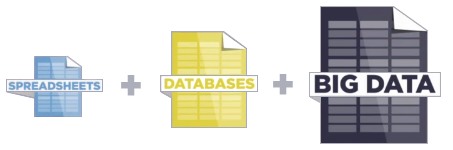
Working with massive data? Tableau’s Data Engine is blazing fast. With Tableau you don’t have to use anything less than all the data you need. Tableau’s architecture-aware approach means you can bring all your data right onto your laptop and still have interactive response time.
Work with hundreds of million of rows of data right on your own computer. Get answers in seconds. It’s real-time business analytics for real-time business data.
Publish to Tableau Server and collaborate with colleagues. They can also work at blazing speeds from your shared data sources.
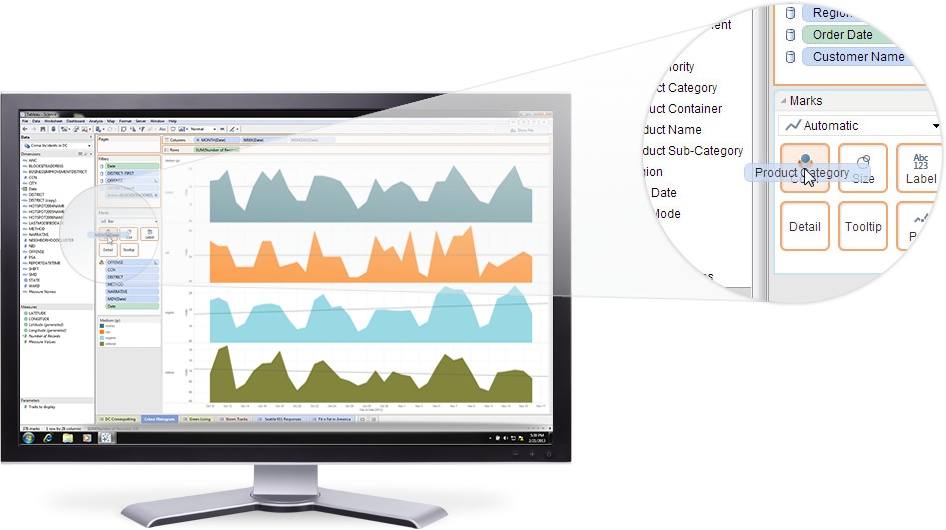
Ease of use to ease your mind
Tableau Desktop is an intuitive, drag-and-drop tool that lets you see every change as you make it. Work at the speed of thought, without ever taking your eyes off the data. Anyone comfortable with Excel can get up to speed on Tableau quickly. Business leaders use it to see and understand many facets of their business at a glance. Scientists use it to create sophisticated trend analyses. Marketers use it to make data-driven decisions that drive ROI through the roof. What will you do with it?
People See the Advantages
Tableau’s user interface is easy to use, but we’re careful never to confuse ease of use with limitations. Tableau lets you create rich visualizations and dashboards in minutes. Download a free trial and see for yourself.
Return to top
data visualization software
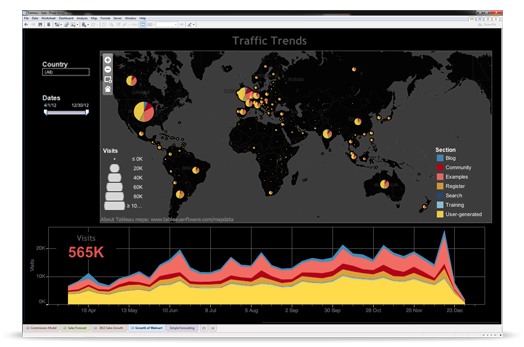
Smart, fit and beautiful dashboards
Combine multiple views of data into a single dashboard. Insert web pages, images and documents for better storytelling and faster insight. Highlight and filter related data. Just like your views, dashboards can be connected to live data, or you can use the built-in Data Engine to speed up your analysis.
When you create brilliant dashboards in Tableau you can share them–-along with your aha! moments–on Tableau Server. Or keep those beauties all to yourself. Either way, Tableau is the data visualization software that will help you take your analytics to the next level.
See Visual Gallery
Direct connect & go
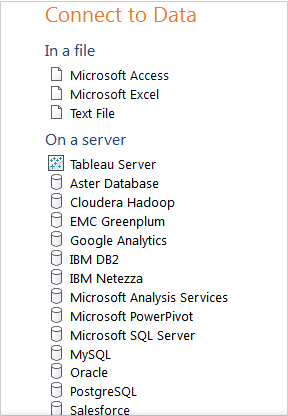
Imagine if you could reach into any database and just start analyzing its data, without the need to prepare anything in advance? Old-school business intelligence platforms require users to build elaborate “universes” and “cubes” and “temporary tables” before any real work can be done. Tableau eliminates those steps completely. There’s no requirement to pull data into a silo–you work directly from your database. You can manage your own data connection and metadata, and your work will never impact the production database.
In Tableau you can connect directly to databases, cubes, data warehouses, files and spreadsheets. Your connection is live so you see up-to-the-minute data. It takes only a few clicks; no programming is required. In minutes you’ll be accessing data, consolidating numbers, and visualizing results without advance set-up. It’s true ad-hoc business analytics.
Download a free trial and connect directly to your date using Tableau Desktop.
Perfect mashups
Connect to data in one click and layer in a second data source, or a third. Want to add population data from the census to your sales data to see penetration rates? Click. Want to extend your production data with shipping data from those same dates? Click. Combining data sources in the same view is so easy it feels like cheating. You can even filter from one data source to another and highlight across data sources. Just go get that extra data and throw it into the mix.
See Tableau’s data blending in action
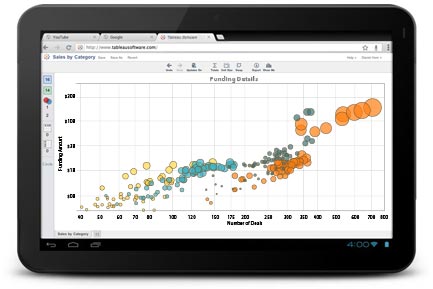
Analytics on the iPad, Android tablets, SharePoint and everywhere
Develop in minutes, share to thousands. Using Tableau Server you can publish interactive dashboards to the web in seconds, then embed them in a SharePoint site or view them on an iPad or Android tablet. Because your viewers need only a web browser or a tablet to filter, sort, and answer their own questions, they can engage anywhere, anytime. Finally, data analysis moves out of the back office and into the core of your business.
It takes only a few clicks to publish, and you don’t need to make changes for your dashboards to show up on web browsers, mobile Safari, or the Tableau Mobile app. So you spend your time on analysis, not on IT.
Best practices in a box
Born at Stanford and raised by a pack of wild PhDs, Tableau has best practices built right in. You get the benefit of years of research on the best way to represent data, from carefully optimized color schemes that tell clear stories, to built-in worldwide mapping, and an elegant design that keeps users focused on what’s important. You ask the question, and Tableau will help you see the answer.
Our goal is to provide data visualization software that helps you understand and communicate information in the most effective way possible.